1 Preface
The purpose of this book is to teach you skills in computer programming to help you analyse commonly collected data in a Sports Science and Coaching environment.
What this book is
This books is intended to be a cookbook based approach. It has problems and it has solutions. Recipes are provided from which you can edit the necessary portions for your needs.
What this book is not
This book does not cover any one topic in extensive detail. If you are interested in conducting analyses or creating plots not covered in the book, I’m sure you’ll find the answer with a quick Google search!
1.1 Why is R so great?
R is 100% free and as a result, has a huge support community. Unlike SPSS and even Excel, R is, and always will be completely free. This means that you can actually apply these skills to your workplace after you graduate. There is also a huge community of R programmers who will constantly develop and distribute new R functionality and packages at a speed that leaves all those other packages in the dust! If you ever have a question about how to implement something in R, a quick Google search will lead you to your answer virtually every single time.
R is incredibly versatile. You can use R to do everything from calculating simple summary statistics, to performing complex simulations to creating gorgeous plots. If you can imagine an analytical task, you can almost certainly implement it in R.
Analyses conducted in R are transparent, easily shareable, and reproducible. If you ask an SPSS user how they conducted a specific analyses, they will either A) Not remember, B) Try (nervously) to construct an analysis procedure on the spot that makes sense - which may or may not correspond to what they actually did months or years ago, or C) Ask you what you are doing in their house. I used to primarily use SPSS, so I speak from experience on this. If you ask an R user (who uses good programming techniques!) how they conducted an analysis, they should always be able to show you the exact code they used. Of course, this doesn’t mean that they used the appropriate analysis or interpreted it correctly, but with all the original code, any problems should be completely transparent!
1.2 Why R is like a relationship…
Yes, R is very much like a relationship. Like relationships, there are two major truths to R programming:
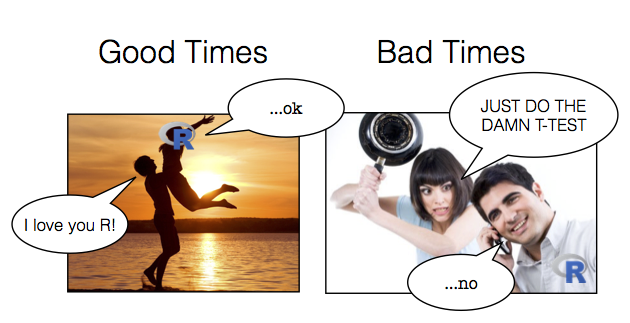
Figure 1.1: R will become both your best friend and your worst nightmare. The bad times will make the good times oh so much sweeter.
There is nothing more frustrating than when your code does not work
There is nothing more satisfying than when your code does work!
Anything worth doing, from losing weight to getting a degree, takes time. Learning R is no different. Especially if this is your first experience programming, you are going to experience a lot of headaches when you get started. You will run into error after error and pound your fists against the table screaming: “WHY ISN’T MY CODE WORKING?!?!? There must be something wrong with this stupid software!!!” You will spend hours trying to find a bug in your code, only to find that - frustratingly enough, you had had an extra space or missed a comma somewhere. You’ll then wonder why you ever decided to learn R when SPSS was so “nice and easy.”
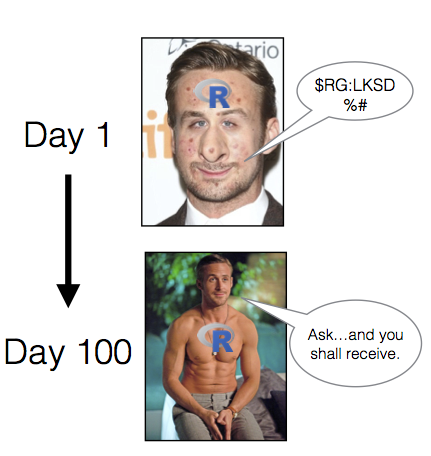
Figure 1.2: When you first meet R, it will look so fugly that you’ll wonder if this is all some kind of sick joke. But trust me, once you learn how to talk to it, and clean it up a bit, all your friends will be crazy jealous.
Trust me, as you gain more programming experience, you’ll experience fewer and fewer bugs (though they’ll never go away completely). Once you get over the initial barriers, you’ll find yourself conducting analyses much, much faster than you ever did before.
1.3 3 things students get wrong
There are 3 common errors students make which will result in alot of head banging, and feeling frustrated. Be aware of these errors, and do not fall into the trap.
1.3.1 Wrong method of launching software
This is the biggest source of frustration.Once you have created a project folder for your work, ONLY launch the software by clicking on the blue cube symbol as seen in Figure 1.3. In chapter 4, I will explain why you should launch the software in this manner.

Figure 1.3: This is the symbol to press to launch the software in your asssignment.
1.3.2 Not running code from START
Looking at the figure 1.4 below, say you ran the code from line 3 to line 20, when you close the software - maybe leaving the work partially done for the day, the next time you launch the software, it has no recollection of where you stopped. You need to run the software from the first line of the code to where you stopped, and then continue with your work.
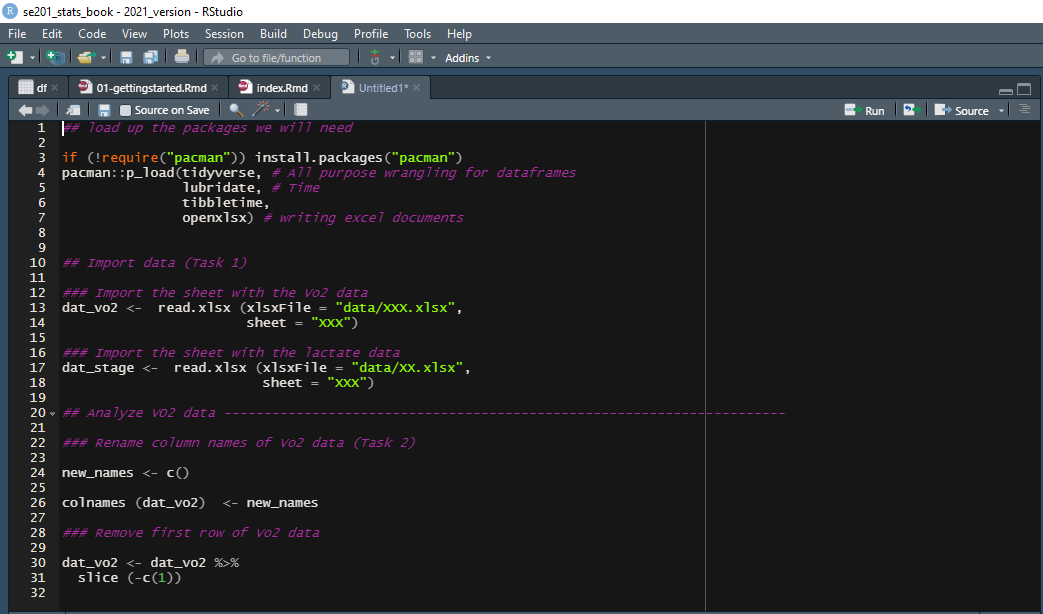
Figure 1.4: If you restart your analysis, the software does not have a memory of where you stopped previously .
1.3.3 Typographical errors
More than 50% of the student queries in the past, centered around the issue of typographical errors. Given that humans can (and do) communicate without perfect grammar, punctuation, and spelling, you WILL naturally assume (wrongly) that computers can ignore mistakes as we can. Computers cannot distinguish what is or is not supposed to be there. For example, if you create a table and call it mytable, but then tried to do some calculations on my table, and error will appear, such as Error: unexpected symbol in "my table". This error means the computer cannot find my table, only because it does not EXIST.
1.4 R resources
1.4.1 R books
There are many, many excellent (non-pirate) books on R, some of which are available online for free. Here are some that I highly recommend:
| Book | Description |
|---|---|
| R for Data Science by Garrett Grolemund and Hadley Wickham | The best book to learn the latest tools for elegantly doing data science. |
| R Graphics Cookbook by Winston Chang | Is indispensible for creating graphics. |
| R Cookbook by James (JD) Long and Paul Teetor | Is a useful bag of tips and tricks to get started with R . |